In our beginner-friendly guide, we delve into understanding this chart. We’ll clarify how to read it, discuss its precision, point out its shortcomings, and offer tips on incorporating it into your trading approach. This article is crafted for everyone, from experienced traders to newcomers in the cryptocurrency world, offering essential insights to effectively utilize the BTC rainbow chart.
What is the Bitcoin Rainbow Chart?
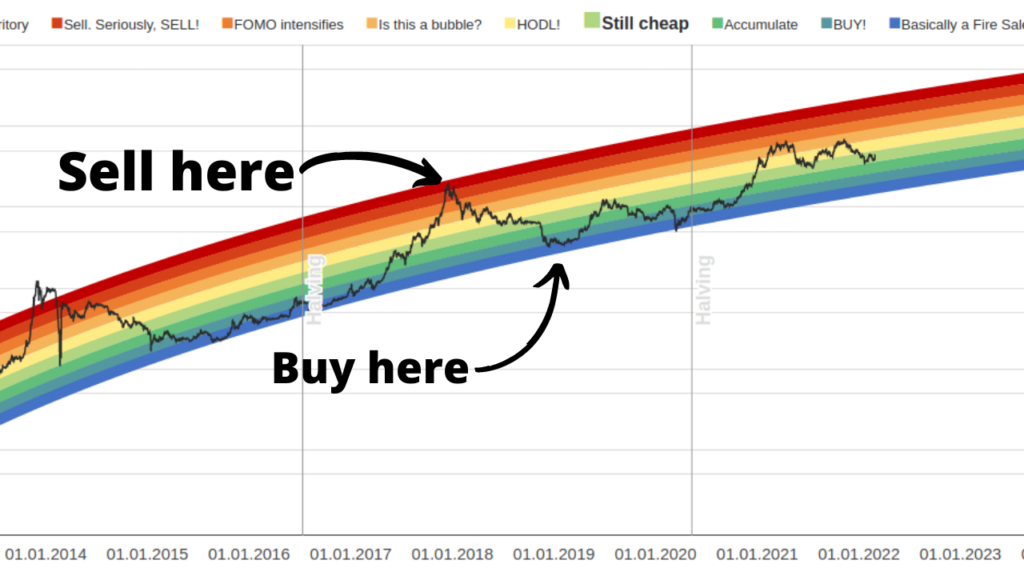
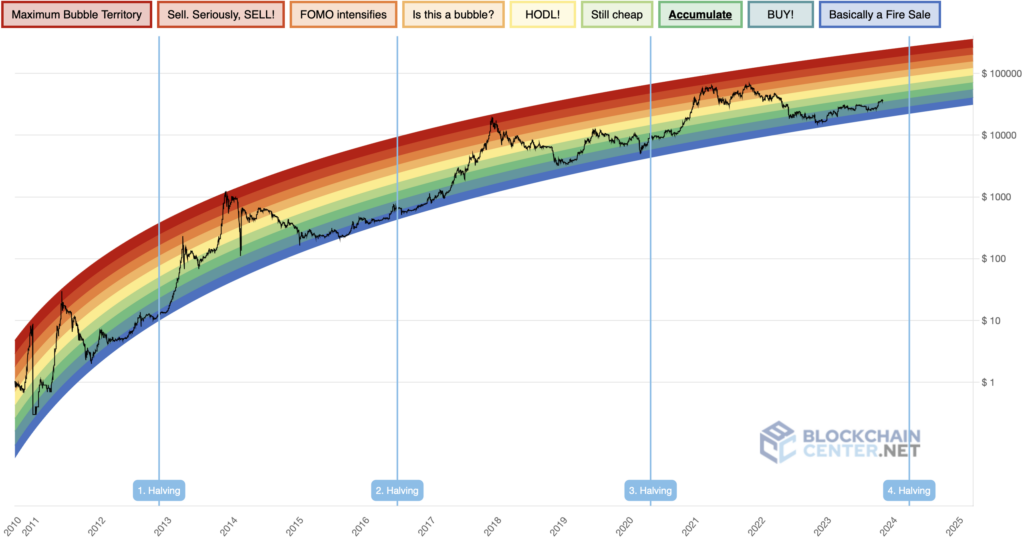
The Bitcoin Rainbow Chart is a unique way for analysts to visualize Bitcoin’s price movements over the years. Rather than using a standard linear price scale, the chart maps Bitcoin’s value on a logarithmic scale divided into colored sections. Each color represents a different percentage gain for Bitcoin.

The chart originated in 2014 from a BitcoinTalk forum user named Trolololo, who applied logarithmic regression to Bitcoin’s historical price data to create a curve reflecting its growth pattern. The color-coded bands were added later, making it easier to identify when Bitcoin was overbought or undervalued.
The Rainbow Chart is constructed using Bitcoin’s historical closing prices, then applying logarithmic regression to plot the data. Different colored bands are assigned to specific price change percentages. This colorful visualization makes it simpler to comprehend Bitcoin’s long-term trends and identify potential buying or selling opportunities based on the current placement of its price.
How to Read and Interpret the Bitcoin Rainbow Chart
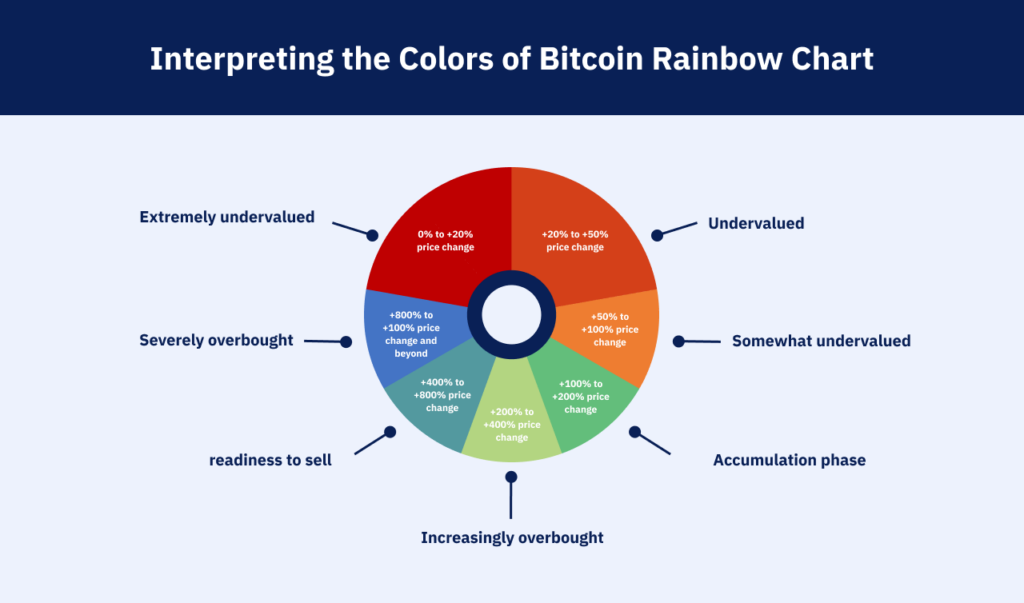
The key to gleaning insights from the Bitcoin Rainbow Chart lies in properly interpreting its color spectrum. Each band represents a price range and market sentiment.

- Dark Red – 0% to +20% price change – Extremely undervalued
- Red – +20% to +50% price change – Undervalued
- Light Red – +50% to +100% price change – Somewhat undervalued
- Green – +100% to +200% price change – Accumulation phase
- Light Green – +200% to +400% price change – Increasingly overbought
- Blue – +400% to +800% price change – Overbought, readiness to sell
- Dark Blue – +800% price change and beyond – Severely overbought
To use the chart, first identify Bitcoin’s current price band. Compare the current price to historical prices within that band to gauge if Bitcoin is under/overvalued. For example, if Bitcoin is in the green band, it may be a good opportunity to buy Bitcoin or accumulate more.
Next, analyze the overall shape and trends of the chart. A price consistently moving up into higher bands signals a bullish trend. Moving down through bands indicates a bearish trend.
You can complement analysis of color bands and trends with other indicators like moving averages. But always remember – while insightful, the Rainbow Chart is still based on historical data. Use it as one tool among many when considering buying and selling decisions.
Using the Chart to Analyze Bitcoin Price Movements
The Rainbow Chart can be used to identify key support and resistance levels for Bitcoin. Support levels indicate where buying pressure is strong enough to prevent the price declining further. Resistance levels mark where selling pressure restricts upward price movement.
To find support and resistance, look for areas on the chart where Bitcoin’s price struggles to move beyond or bounces off of repeatedly. Connecting these highs and lows with trendlines reveals significant support and resistance levels.
The chart can also determine whether market sentiment is bullish or bearish. When the chart is dominated by greens and blues, sentiment is bullish. More reds indicate bearish sentiment.
Watch for breakouts and breakdowns when Bitcoin’s price pushes beyond historical support or resistance levels, signaling potential trend changes.
While useful on its own, combining the Rainbow Chart with indicators like moving averages, RSI, and volume can validate levels and provide a more robust analysis. The Rainbow Chart spotlights long-term trends, while other indicators assess short-term conditions.
Using the chart alongside other tools allows traders to make better-informed decisions aligned with both historical patterns and present market dynamics.
Is the BTC Rainbow Chart Accurate for Predicting Bitcoin Prices?

While useful, the Bitcoin Rainbow Chart has its critics regarding accuracy for predicting future prices. Some key limitations include:
- Reliance on historical data – The chart’s color bands are based solely on past price performance. It cannot account for current conditions or future changes in the market.
- Subjective construction – The price range assignments for each color band are arbitrary. Different creators can produce variations with different implications.
- Limited factors considered – The chart only looks at price and time. It does not incorporate trading volumes, external news, or other indicators that may influence Bitcoin’s price.
- Susceptibility to manipulation – Charts can be “painted” by whales or coordinated groups to portray certain patterns or sentiments.
- Lagging indicator – Charts always show what has happened, not what will happen next. They cannot lead, only follow price movements.
While the Rainbow Chart has these inherent limitations, it can still provide valuable perspective when used properly. The key is to utilize it as one tool among many, not the only tool, when analyzing Bitcoin’s price and making trading decisions.
When combined with current market data, volumes, news, sentiment, and other technical and fundamental indicators, the chart can help traders make more informed decisions. But relying on it alone as a predictive crystal ball is ill-advised. Use its insights to complement, not replace, comprehensive analysis.
Furthermore, you should note that there are various cryptocurrencies on the market that you can compare with Bitcoin to decide which is a better investment. For example, Ethereum is one of Bitcoin’s competitors. Comparing Bitcoin vs Ethereum can help you make a better decision about buying a cryptocurrency.
Beyond Bitcoin: Rainbow Charts for Altcoins
The popularity of the original Bitcoin Rainbow Chart has led to the creation of similar tools for other major cryptocurrencies like Ethereum.
Ethereum Rainbow Chart shares the same structure as the Bitcoin version – a logarithmic regression curve with color-coded bands representing different price ranges. However, the data only goes back to 2015 when Ethereum first launched.
These altcoin rainbow charts operate on the same principles – utilizing historical pricing data and logarithmic regression to identify overbought or undervalued conditions based on color bands. Traders use them in the same way to spot opportunities to buy low or sell high.
Some key differences arise from the distinct characteristics of each blockchain. For example, Ethereum’s rainbow chart uses different price points for its color ranges that correspond to percentage gains relevant to Ether’s individual price history.
The colors on altcoin rainbow charts also may not always match the schemes used for Bitcoin. Some use red to indicate bullish sentiment rather than bearish.
So while crypto rainbow charts provide similar insights across different assets, each one still requires an understanding of the specific price trends and behaviors of that asset. Traders should not assume all rainbow charts have identical implications just because they share a common structure.
Best Practices for Harnessing the Bitcoin Rainbow Chart
The Bitcoin Rainbow Chart can provide valuable insights for traders, if used judiciously. Here are some tips for getting the most out of it:
- Prioritize long-term analysis – The Rainbow Chart is most beneficial for long-term trading based on identifying overarching trends. Use it to inform decisions with time horizons of months or years, not days or weeks. For short-term trading, rely more on faster-reacting indicators.
- Combine with other indicators – Never make decisions based solely on the Rainbow Chart. Incorporate analysis of trading volumes, volatility, moving averages, RSI, Fibonacci retracements, and macroeconomic factors for robust decision-making.
- Consider speed of price movements – The speed at which Bitcoin’s price moves into a new color band can suggest whether it is undergoing a steady shift or euphoric reaction. Gradual transitions may be more sustainable.
- Account for drastic market shifts – In parabolic bull or bear markets, Bitcoin can overshoot or undershoot its typical price ranges associated with each color band. The current context matters.
- Make objective interpretations – Don’t let emotion or bias influence how you apply the chart’s insights. Develop clear trading rules that dictate actions based on rainbow patterns.
- Focus on probabilities, not predictions – The chart provides clues about probable future price movements based on historical patterns, not definitive prophecies. Act accordingly.
By integrating these best practices, the Rainbow Chart can strengthen trading strategies as one analytical tool among many. Never treat it as a crystal ball, but do leverage its insights to tilt probability in your favor.
Leveraging the Rainbow Chart’s Potential
In summary, while the Bitcoin Rainbow Chart has limitations, its useful visualization of long-term price trends should not be overlooked. When used properly as one analytical tool among many, it can aid in identifying buying and selling opportunities.
By understanding the meanings behind each color band and the patterns that emerge, traders can make more informed decisions aligned with historical data. While not a crystal ball, the insights the Rainbow Chart provides into previous market cycles and sentiment shifts can help traders turn probability in their favor.
Now that you’re equipped with the knowledge of the Bitcoin Rainbow Chart and how to harness its insights for better trading decisions, why wait to get started? Unlock the potential of the Bitcoin Rainbow Chart in your trading. You can easily buy Bitcoin with bank transfer on Blocktrade. Secure, straightforward, and fast – start your cryptocurrency journey now.
FAQs
The BTC Rainbow Chart relies solely on historical price data, therefore you won’t be able to predict future price movements. Also, it does not consider real-time market conditions. The color bands are also based on arbitrary price ranges, so the chart is subjective. It should only be used as one indicator among many in analysis.
The Rainbow Chart is better suited for long-term trading based on spotting overarching trends. For short-term trading, faster indicators like moving averages or RSI should carry more weight in decision making. The Rainbow Chart does not react quickly enough for short-term price movements.
While the Rainbow Chart can provide valuable insights, Bitcoin’s price has broken out of the chart’s projected patterns several times. This highlights the importance of not overly relying on it as a predictive tool. It should inform decisions, not make them outright.
Yes, Rainbow Charts have been adapted for other major cryptocurrencies like Ethereum. However, each chart is tailored to the specific price history of that asset. So ensure you understand the nuances of that particular chart and how it applies to the altcoin.


